
Gold Chart Update for Early-Summer 2025 – Technical Analysis
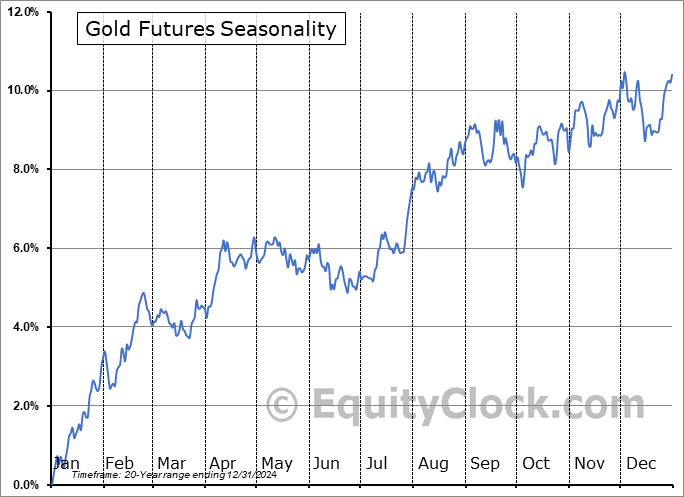
A quick update on the Gold Spot price action as an exclusive for Substack peeps today. Gold reacts positively to crises as recent financial stress, war in the Middle East and Eurasia, and political upheaval have demonstrated the correlation. Despite random events and news cycles, the price action in precious metals usually adhere to annual seasonality and 2025 has been no exception, especially for gold. Of note are the comments made by President Trump concerning the declassification of Russiagate evidence sent to Pam Bondi’s DOJ for potential treason and/or sedition by Obama and his cohorts. During the Oval Office presser today with the Philippine president, Trump went scorched Earth on the Russiagate scandal at timestamps 10:45-18:20 and 24:45-27:32…
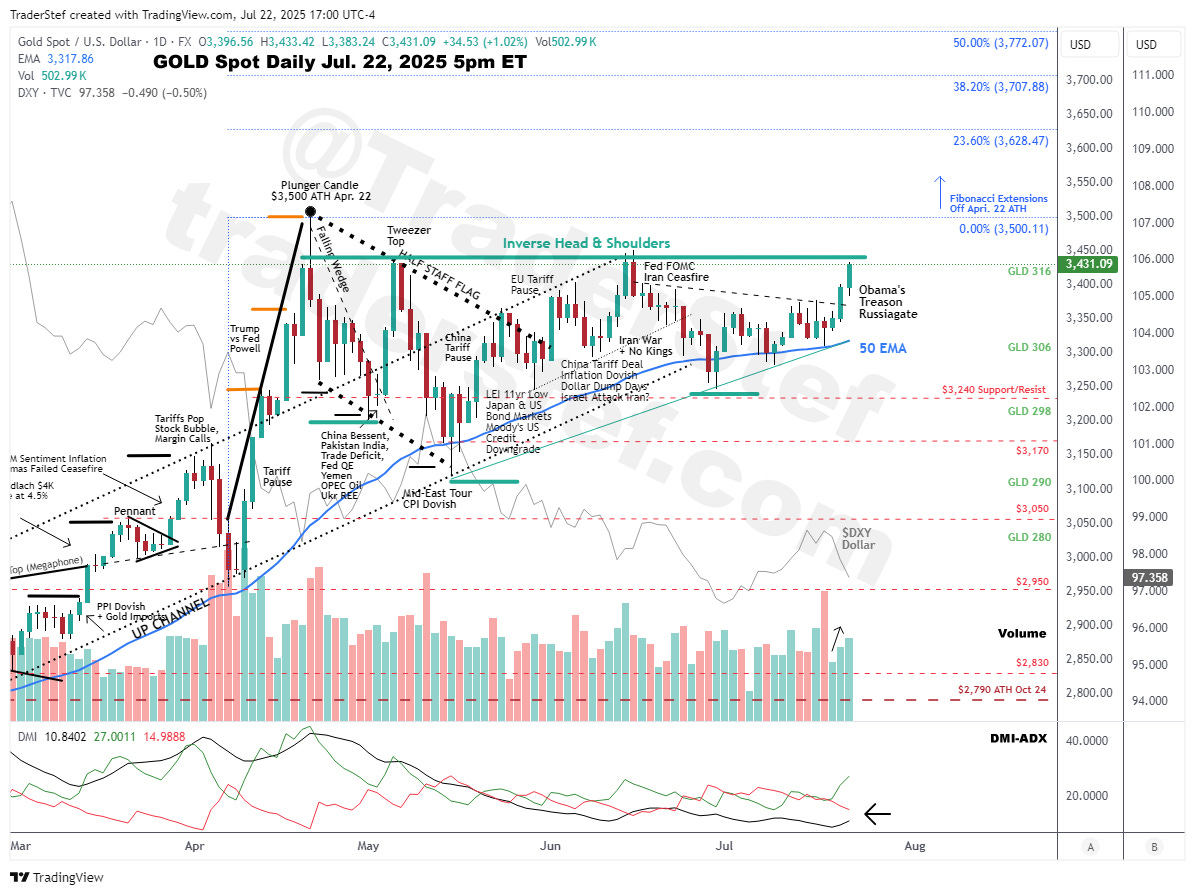
Here is the Gold Spot daily chart as of 5pm ET on Jul. 22, 2025:
In the Jul. 15 update on Silver Spot and note about gold:
“In the late spring update published on April 30, I noted that gold and silver would likely chop into a consolidation that mirrors seasonality price action before a potential summer rally. Gold remains in that process since its Apr. 22 all-time high but there’s a high probability a bullish Inverse Head & Shoulders is forming… Silver decided to deviate and is reminiscent of the rally in late April of 2011 to $49.79 before gold printed an ATH in Sep. 2011… Profit taking on Monday Jul. 14 closed with a bearish Plunger Candle (aka Shooting Star) that closed at $38.09, so expect a breather to establish fresh resistance and support levels before challenging $44 and $50. That move could happen sooner than later.”
The price action in silver printed a new high of $39.30 today and is developing fresh support and resistance levels before a potential challenge of $44 and the $50 all-time high zone (ATH).
Gold Spot is today’s focus with an Inverse Head & Shoulders right-shoulder that rallied to $3,433 and is just shy of Neckline resistance above $3,450 and below the $3,500 ATH. The seasonal consolidation process began with a Half Staff Flag followed by news driven rallies, which morphed into an Inverse Head & Shoulders pattern nested with a Cup & Handle. If the Neckline is not decisively breached and more consolidation takes place, we may have an Ascending Triangle on the table. Either option is bullish and higher price points are likely into August as India’s fall wedding season increases demand for gold and silver. If a powerful rally develops, the next price levels to watch are Fibonacci Extensions in blue sky territory around $3,630, $3,710, $3,775, and $3,836. Support levels for any pullback are annotated.
Stay frosty if trading paper, and keep those bullion coins safe.
Plan Your Trade, Trade Your Plan
Not a Financial Advisor: None of the content produced by TraderStef™, staff members, or any services associated with this website should be construed as financial or investment advice. Financial investment is a risky endeavor and may lead to substantial loss. Always perform due diligence before undertaking any financial decision – Copyrighted Material: A “by TraderStef” credit linked back to this website is required when using any quotes, technical analysis charts, or publishing a partial version of an article.